Project Overview
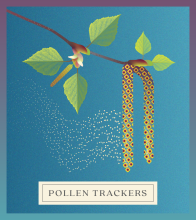
In the US alone, an estimated 60 million people suffer from pollen allergies each year (CDC.gov). Climate change is projected to impact the timing of the start, length, and severity of pollen season. Better predictions of airborne pollen can inform allergy sufferers when to stay indoors or when pharmacies should stock allergy medicine.
Preliminary analyses indicate a strong relationship between flowering of particular species and how much pollen is in the air. Your data collected as part of this campaign will be used to help fill gaps in understanding pollen concentrations in real-time, leading to improved forecasts of allergy season timing and severity. Further, since the observations you contribute to Nature’s Notebook are available to users very soon after you submit them, they allow for pollen forecasts to be updated in near-real time with incoming reports.
Sign up for Pollen Trackers messages
You will receive messages full of findings, observation tips, and campaign-specific opportunities. Don't miss out!
See what we are learning from this campaign
How to Participate
Join Nature's Notebook and select one or more trees or shrubs from the list to track. Observe flowering and pollen release ideally 2–3 times per week during spring and summer, and log your data in Nature's Notebook. Need help getting started? Take the Observer Certification Course.
Increase the value of your data by adding the specific location of your Pollen Trackers plant when you add it to your site.
Pollen Trackers Species
This campaign includes 171 species in 26 genera:
- Abies (5 species)
- Acer (14 species)
- Alnus (3 species)
- Ambrosia (3 species)
- Betula (9 species)
- Calocedrus (1 species)
- Carya (5 species)
- Celtis (4 species)
- Chamaecyparis (1 species)
- Fraxinus (5 species)
- Juglans (3 species)
- Juniperus (8 species)
- Larix (3 species)
- Liquidambar (1 species)
- Metasequoia (1 species)
- Picea (5 species)
- Pinus (20 species)
- Platanus (2 species)
- Populus (8 species)
- Pseudotsuga (1 species)
- Quercus (42 species)
- Salix (17 species)
- Taxodium (1 species)
- Thuja (1 species)
- Tsuga (3 species)
- Ulmus (5 species)
Top 10 Contributing Programs
Local Phenology Programs with the most observation records submitted this year.
| # | Program | Observations |
|---|---|---|
| 1 | The Arboretum, State Botanical Garden of Kentucky | 60,086 |
| 2 | Crosby Farm Park ASCC | 55,075 |
| 3 | Earthwise Aware | 44,888 |
| 4 | MAC Citizen Scientists | 42,615 |
| 5 | Great Smoky Mountains NP | 36,662 |
| 6 | New York Botanical Garden Forest Phenology | 20,916 |
| 7 | Prescott Creeks/Watson Woods Riparian Preserve | 18,613 |
| 8 | Appalachian Mountain Club | 15,125 |
| 9 | University at Buffalo | 14,620 |
| 10 | Mohonk Preserve | 12,552 |
Earn your Pollen Trackers badge
See it on your Observation Deck.
Research team
Daniel Katz, Cornell University
Claudia Langford Brown, CDC Climate and Health Program
Arie Manangan, CDC Climate and Health Program
Yi Liu, University of Michigan
Kai Zhu, University of Michigan
Guy Robinson, Fordham University, New York, NY
Dan Dalan, MD, Allergist, MercyOne Waterloo Medical Center, Iowa
Questions about this campaign? Email Erin Posthumus at erin@usanpn.org.